Dutton Institute Blog

Understanding Canvas Announcements - What happens when I import announcements to a new Semester

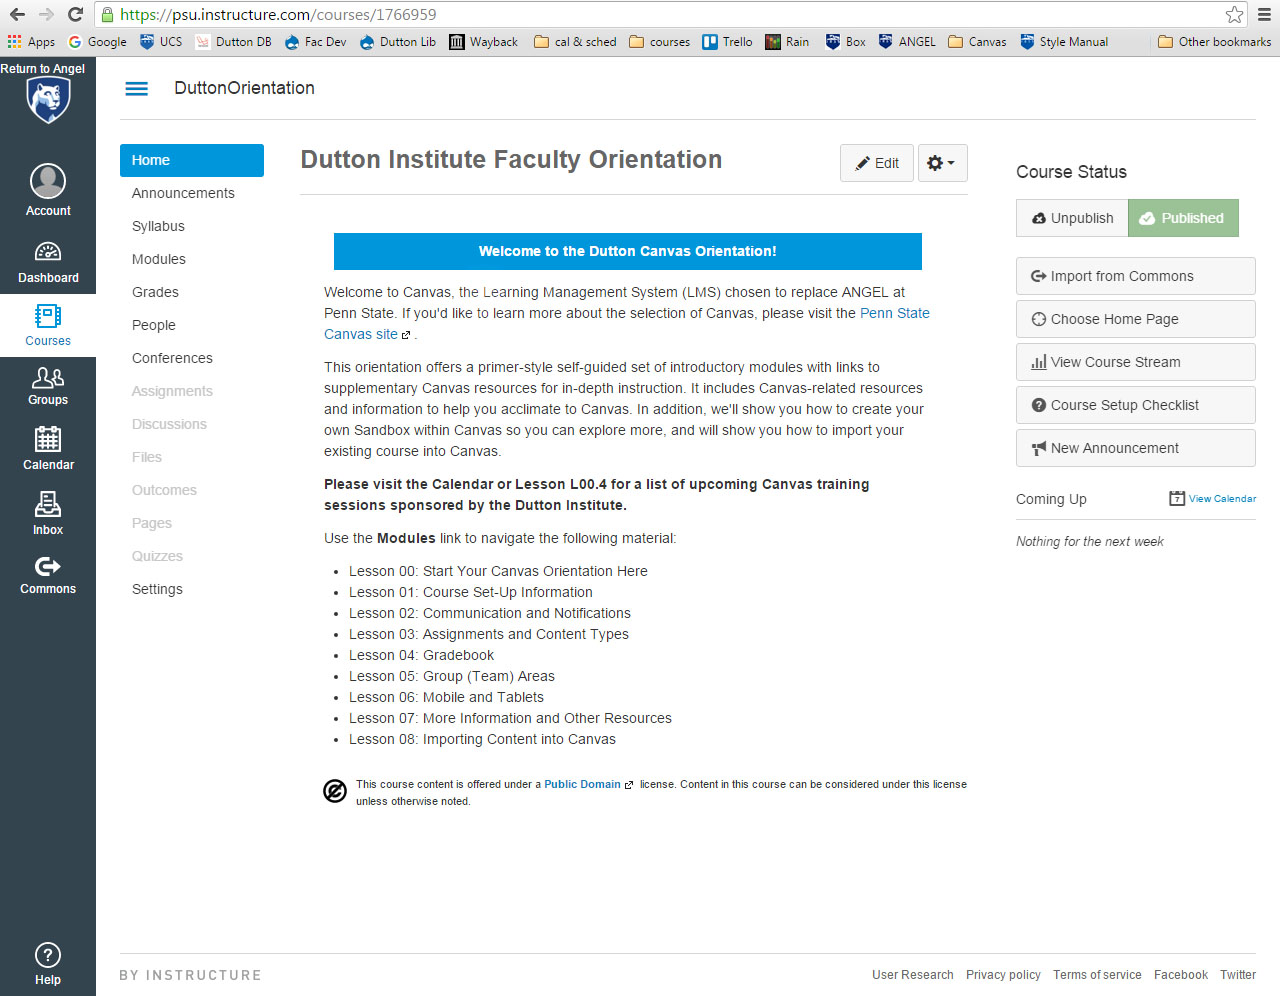
When you copy an entire Canvas Course from one semester to another, course announcements also come over.  It can be tricky to understand how these copied over announcements behave in your new course. 

I’ve compiled a list of notes and suggestions to help understand how Announcements work:

  • When creating new Announcements, add a delay date to the posting.  Even if your delay is minutes when you originally want to post, the post date will be adjusted along with all your other event and due dates when you copy your course.
  • After copying a course, go through Announcements and delete any Announcements that are not applicable for the current semester.  
  • No Announcement will be sent when a course is not published.
  • If an Announcement post date is before the course publish date, students will be able to see the announcement in the new Course, but will not receive an email notification when the course is published.
  • Any Announcement that does not have a delay post date will be viewable to students when the course is published.  These announcements are not sent to students unless you edit the announcement.  After editing and as soon as you save the announcement, it will be emailed to the address students have set up in their notifications, unless you have set up a delay date.

For more information on how Canvas Announcements work, feel free to look at the PSU Canvas Learning Center on Communicating with Students, contact Canvas Help or contact one of the Learning Designers in Dutton. 

~ Jane Sutterlin

Creating a Welcoming Presentation

Members of the Dutton Learning Design team recently produced the following video, entitled Creating a Welcoming Presentation, for the Online Learning Consortium. This 3-minute video features tips for making sure your presentations are understood and seen by all and that they are inclusive to every member of your audience. As the speaker, you set the tone and help your audience engage! 


Study Skills

Looking for a way to help your students get more out of their studies? The study of effective teaching and learning strategies is sometimes known as the science of learning, and it delves deep into cognitive science to inform the ways we teach and learn. Research-backed strategies have proved to be effective for students of all ages.

Click the image below to download PDF files of these Study Skills handouts, and check out this article from Cognitive Research: Principles and Implications for more information: "Teaching the Science of Learning."

link to study smarter, Not Harder infographics

Click for an accessible version of the handouts. (This will expand to provide more information.)
 
Topic(s): 

Getting Started with Kaltura - DRAFT

Anytime a new technology is adopted they the whole University, it takes a while for the tool to get spun up and used as it was intended. Kaltura is not different. ITLD is working hard to pull together complete training resources and Training Paths which will be distributed as soon as they are completed. We will be sure to inform everyone when that happens. Until that time, this blog post is available to give you just enough information to get started using Kaltura. It is lot complete guide, but is a resource to help you start to use Kaltura.

What Kaltura Tools are Available in Canvas?

Canvas App User Guide

Kaltura and Zoom

Media Space Login

Kaltura


Strategies for Building in Academic Integrity

Building Academic Integrity into the design of the course and the assessments.

  • Set time limits on quizzes and exams.
  • Use and leverage test banks or groups in Canvas.
    • Create several questions that cover the same objective at the same level.
    • Add new questions each time the course is taught to have more versions. Consider starting with 3 versions of each questions and an 1-2 more versions each time you teach. Eventually, you will have a large bank to draw from without having to write a new quiz or exam each semester.
  • Change essay questions regularly or at least cycle through a few different ones from year to year.
  • Use the same problems, but  give students different data to use from semester to semester. 
  • Use video to have student record themselves answering questions as a backup if you suspect an issue might arise.
  • Use proctoring if it is available.
If you want a more comprehensive look at strategies for preventing academic integrity, take a look at Strategies for Preventing Academic Integrity Issues
 
For more information on academic integrity policies and procedures see Dutton's Academic Integrity page
 
Topic(s): 

Interactive Flowcharts

During course development, a faculty member was interested in finding a way to make her pictures of flowcharts interactive. I was able to assist her with this by using Adobe Captivate to create an interactive flowchart. This is what the flowchart looked like before:

Flow chart to determine whether the data meets the requirements for hypothesis testing.
Credit: J. Roman

This is what the interactive piece looks like now:

First part of flowchart: is your data an independent random sample? Yes, Is your data parametric? Click yes or no.

Instead of viewing a stagnant flowchart, students can now choose their path by clicking on the buttons in the interactive element.

Same piece of flowchart above with additional pieces of flowchart. The next part of flowchart begins with question: is your data normally distributed?

There is also an option to restart the process, so students can start over if they want to see what would have happened if they had chosen another path. The interactive flowchart is visually appealing and allows students to focus more closely on the smaller pieces of the flowchart by working through a decision-making process.

The interactive element is not fully accessible with a screen reader, therefore, it is recommended to create an accessible version of the chart. This can be done by providing a long description of the flowchart. There should be text above the interactive element noting its presence below, as well as an indication that there is an accessible version available. This text indication can be made visible to screen readers only.

Videos for missed points

Here’s an innovative idea to promote deep learning: allow students to make up missed exam points by creating their own short videos to explain the missed concepts. Once evaluated for accuracy, the videos can be posted for classmates to discuss and also use for study.

Shouldn’t these videos be proctored? Won’t students simply try to read their explanations? You’ll have to tweak this exercise to fit your needs, but explanations should require that students do some research and planning in order to create effective videos. And requiring students to act as teachers is a great way to promote learning. 

Here’s one teacher’s experience with this idea, from www.facultyfocus.com:

Students Recoup Exam Points by Creating a Video on Items Missed
 

Polling Tools

I was recently asked by a faculty member to help find a way for students to sign up for topics to research in his class instead of him assigning them each topic. Using this particular process does two things. First, it gives the student the power to choose a topic that interests them. Second, it gives the faculty member some extra time to engage with students. A web search will reveal lots of options for creating a poll. Some options require that users sign up for an account and others do not. Some tools are easier to use while others are more flexible and have more options. The tools listed below have one charateristic in common, they are all free. The faculty member who I was working with did not need dates associate with the topics on the poll, he just needed a list of topics and an area for a student to add their name. All of the tools listed below will do that. In the end, he selected Doodle because he was familiar with it and it is simple for everyone to use. These are both great reasons when selecting a tool to use. 

  1. SignUp Genius
  2. Doodle
  3. SignUp.com
  4. Google Forms
  5. Google Sheets


Topic(s): 

Free Image Resources Here!

computer keyboard

Credit: Public Domain


Mike Taylor, of Mindset Digital, recently presented a webinar devoted to helpful resources that can be added to a course design toolkit. Below you will find a selection of a few of these resources, which can be hugely helpful in finding visual imagery to accompany course content or presentations. Enjoy!

  • Images: Pixabay contains nearly 1 million free images and videos that you can add to your course/website.
  • Fonts: Google fonts contains an extensive library (over 800) of font families that can be embedded into a web page or CSS.
  • Icons: These can be a nice addition to a Drupal or Canvas page.  Flat Icon contains a large database of free icons in a variety of formats.
  • Mike Taylor’s Blog contains a more thorough list of links to helpful resources. Check it out!

As always, the Dutton Institute learning design team is available to assist you with all of your course needs, including multimedia.

Topic(s): 

Analytics, Big Data, Assessment, and the Interconnectedness of All Things

Here are some resources that, in whole, present a web of ideas surrounding predictive analytics, big data, assessment and the roles each of these is playing in shaping and changing student attitudes, learning, and educational systems. 

  • Penetrating the Fog: Analytics in Learning and Education by Long and Siemens (2011, Educause Review), examines the idea that data collection (including student data trails and activity streams mined from online courses) can yield vast amounts of information that, when analyzed, could be used to improve learners’ experiences, spark comparison between institutions, and affect pedagogical approaches, course design, and institutional decision-making.
  • Many issues come into play when thinking about students, data, and analytics (like the danger of a return to behaviorism!), and Ekowo and Palmer’s Predictive Analytics in Higher Education: Five Guiding Practices for Ethical Use offers guidance for developing a valid system and for navigating issues like privacy and bias.
  • A related article, Fritz’s Student-facing Learning Analytics and Self-regulated Learning: Check My Activity at UMBC (2017) discusses student responsibility and motivation as related to student-facing learning-analytics. The Check My Activity tool, developed to work in conjunction with the Blackboard LMS, allows students to compare their individual activity with that of anonymous classmates and has been shown to boost performance.
  • Finally, the 2007 article Assessment Through the Student’s Eyes, by Rick Stiggins, sparks thoughts about how students of all ages are “data-based decision makers” who, when fully included in the assessment process, can help themselves build and maintain success.
Topic(s): 

Pages